注册免广告
您需要 登录 才可以下载或查看,没有账号?立即注册
×
本帖最后由 HelloWorld 于 2024-10-26 08:17 编辑
题目:
You should spend about 20 minutes on this task. Write at least 150 words.
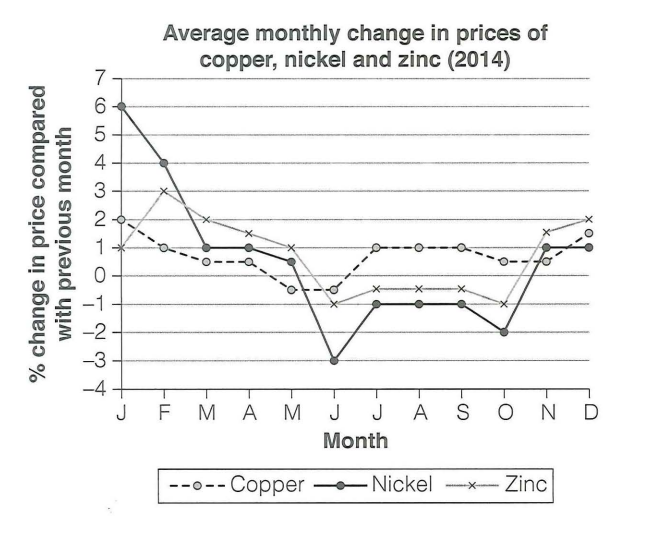
The graph below shows the average monthly change in the prices of three metals during 2014.
Summarise the information by selecting and reporting the main features, and make comparisons where relevant.

范文 1(7 分, 174 单词):
The graph illustrates the monthly percentage changes in the prices of copper, nickel, and zinc throughout 2014.
Overall, nickel experienced the most dramatic fluctuations, while copper and zinc saw more stable trends. By the end of the year, all three metals showed similar price increases, settling around 1% to 2%.
Nickel started with a sharp rise, peaking at 6% in January, followed by a significant decline to -3% in July. However, it recovered slightly to finish the year at 1%. Despite its high initial price increase, nickel ended as the lowest among the three metals.
Copper showed more moderate changes, beginning at 2% in January and peaking at 3% in February. It then gradually declined, reaching its lowest point of -1% in July and October, before rebounding to 2% in December, placing it second.
Zinc, the most stable of the three metals, began with a small increase of 1% and fluctuated slightly throughout the year. Despite slight dips below 0% in May and July, it ended the year as the highest of the three, at approximately 2%.
|
范文 2(7 分,154 单词):
The line graph illustrates the monthly percentage changes in the prices of three metals - copper, nickel and zinc - throughout 2014.
Overall, nickel displayed the most volatile price fluctuations, while copper and zinc showed relatively moderate changes. By the end of the year, all three metals converged to similar price levels, showing increases between 1% and 2%.
The most striking feature was nickel's dramatic movement, beginning the year with a sharp 6% increase in January, followed by a steep decline over the next six months, reaching its lowest point of -3% in July. After maintaining relatively stable negative growth from July to October, nickel prices recovered notably in the final two months.
In contrast, both copper and zinc exhibited more modest variations. Copper maintained a relatively narrow range between -1% and 3%, with slight fluctuations throughout the year. Zinc showed the most stability among the three metals, generally staying between 0% and 3%, despite brief dips below zero in May and July. Interestingly, zinc finished the year with the highest growth rate among the three metals.
|
范文 3(7 分,166 单词):
The graph illustrates the average monthly percentage change in the prices of copper, nickel, and zinc throughout 2014. Overall, nickel exhibited the most volatility, while copper and zinc had more stable price movements within a narrower range.
Nickel's price started the year with a significant rise of 6% in January, making it the highest among the three metals. However, its price plummeted to -3% by July, marking the lowest point. Subsequently, nickel's price saw a gradual recovery, ending the year at 1%.
Copper, beginning at 2% in January, experienced a peak of 3% in February. The price then declined, hitting its lowest at -1% in both July and October, but eventually stabilized at 2% in December, maintaining a middle position overall.
Zinc, starting at 1%, exhibited the most consistent performance throughout the year. Despite minor dips below 0% in May and July, zinc's price steadily increased and concluded the year as the highest, within the 1-2% range.
|
范文 4(7 分,160 单词):
The line graph compares the average monthly percentage changes in the prices of copper, nickel, and zinc during 2014.
Nickel exhibited the most volatile price behavior throughout the year. It experienced a substantial surge of 6% in January, followed by a sharp decline to -3% in July. The price then gradually recovered, ending the year with a 1% increase. In contrast, copper and zinc displayed relatively modest fluctuations, with their prices generally fluctuating between -1% and 3%.
Copper prices began the year on an upward trend, reaching a peak of 3% in February. However, they subsequently declined to a low of -1% in July and October before recovering slightly by the end of the year. Zinc prices followed a similar but less pronounced pattern, with a gradual increase from January to December, albeit with minor dips in May and July.
The significant price fluctuations of nickel compared to copper and zinc may be attributable to factors such as changes in global demand for nickel-intensive industries, supply disruptions from major producing countries, or speculative trading activities. Further analysis would be required to determine the specific causes of these price movements.
|
这篇范文是谷歌 Gemini 写的,它最后给出了数据波动原因的猜测,但是按照 Simon 的说法,小作文描述事实就行,不要给猜测,因为这个在评分标准里没有得分点
a 类小作文最具有模板性,分析数据走势常用词和转折词也就那几个,习惯地用起来应该可以加分不少
|